Coleman McCormick

Archive of posts with tag 'Open Data'

āœ¦
āœ¦

Weekend Reading: Looking Glass Politics, Enrichment, and OSM Datasets

July 18, 2020 ā€¢ #

šŸ‡ Looking-Glass Politics

On private emotions being thrown into the public sphere:

People escape the Dunbar world for obvious reasons: life there appears prosaic and uninspiring. They find a digital interface and, like Alice in Through the Looking-Glass, enter a new realm that glitters with infinite possibilities. Suddenly, you can flicker like a spark between the digital and the real. The exhilarating sensation is that you have been taken to a high place and shown all the kingdoms of the world: ā€œThese can be yours, if. . . .ā€ If your video goes viral. If you gain millions of followers. If you compose that devastating tweet that will drive Donald Trump from the White House. There is, however, an entrance fee. Personal identity must be discarded.

šŸ­ The Great Enrichment

Deirdre McCloskey on the boom of progress over the past 200 years:

The Great Enrichment came from human ingenuity emancipated. Ordinary people, emboldened by liberalism, ventured on extraordinary projectsā€”the marine chronometer, the selective breeding of cotton seed, the band saw, a new chemistryā€”or merely ventured boldly to a new job, the New World, or going west, young man. And, crucially, the bold adventurers, in parallel with liberations in science, music, and geographical exploration, came to be tolerated and even commended by the rest of society, first in Holland in the 17th century and then in Britain in the 18th.

šŸ—ŗ OSM-ready Data Sets

A partnership between Esri, Facebook, and the OpenStreetMap community to polish up and release datasets readily compatible with OSM (tagging and licensing).

āœ¦
āœ¦

Weekend Reading: Chess, COVID Tracking, and Note Types

March 21, 2020 ā€¢ #

ā™Ÿ Chess

Tom MacWright on chess. Reduce distraction, increase concentration

Once you have concentration, you realize that thereā€™s another layer: rigor. Itā€™s checking the timer, checking for threats, checking for any of a litany of potential mistakes you might be about to make, a smorgasbord of straightforward opportunities you might miss. Simple rules are easy to forget when youā€™re feeling the rush of an advantage. But they never become less important.

Might start giving chess a try just to see how I do. Havenā€™t played in years, but Iā€™m curious.

šŸ§Ŗ The COVID Tracking Project

The best resource Iā€™ve run across for aggregated data on COVID cases. Pulled from state-level public health authorities; this project just provides a cleaned-up version of the data. Thereā€™s even an API to pull data.

āœšŸ¼ Taxonomy of Note Types

Andy Matuschakā€™s notes on taking notes. This is from his public notebook, like reading someone thinking out loud (or on a screen at least).

āœ¦
āœ¦
āœ¦
āœ¦
āœ¦
āœ¦
āœ¦
āœ¦

Weekend Reading: Fulcrum in Santa Barbara, Point Clouds, Building Footprints

February 2, 2019 ā€¢ #

šŸ‘ØšŸ½ā€šŸš’ Santa Barbara County Evac with Fulcrum Community

Our friends over at the Santa Barbara County Sheriff have been using a deployment of Fulcrum Community over the last month to log and track evacuations for flooding and debris flow risk throughout the county. Theyā€™ve deployed over 100 volunteers so far to go door-to-door and help residents evacuate safely. In their initial pilot they visited 1,500 residents. With this platform the County can monitor progress in real-time and maximize their resources to the areas that need the most attention.

ā€œThis app not only tremendously increase the accountability of our door-to-door notifications but also gave us a real time tracking on the progress of our teams. We believe it also reduced the time it has historically taken to complete such evacuation notices.ā€

This is exactly what weā€™re building Community to do: to help enable groups to collaborate and share field information rapidly for coordination, publish information to the public, and gather quantities of data through citizens and volunteers they couldnā€™t get on their own.

ā˜ļø USGS 3DEP LiDAR Point Clouds Dataset

From Howard Butler is this amazing public dataset of LiDAR data from the USGS 3D Elevation Program. Thereā€™s an interactive version here where you can browse whatā€™s available. Using this WebGL-based viewer you can even pan and zoom around in the point clouds. More info here in the open on GitHub.

šŸ¢ US Building Footprints

Microsoft published this dataset of computer-generated building footprints, 125 million in all. Pretty incredible considering how much labor itā€™d take to produce with manual digitizing.

āœ¦

Weekend Reading: Mastery Learning, Burundiā€™s Capital, and SRTM

December 29, 2018 ā€¢ #

šŸŽ“ Mastery Learning and Creative Tasks

Khan Academyā€™s Andy Matuschak on tasks that require ā€œdepth of knowledgeā€ versus those that have higher ā€œtransfer demand.ā€ Both can be considered ā€œdifficultā€ in a sense, but teaching techniques to build knowledge need different approaches:

One big implication of mastery learning is that students should have as much opportunity to practice a skill as theyā€™d like. Unlike a class that moves at a fixed pace, a struggling student should always be able to revisit prerequisites, read an alternative explanation, and try some new challenges. These systems usually consider a student to have finally ā€œmasteredā€ a skill when they can consistently answer related problems over an extended period of time.

šŸ‡§šŸ‡® Burundi Moving its Capital

Itā€™s not every day you see the map changing:

Burundi is moving its capital from the shores of Lake Tanganyika and deep into the nationā€™s central highlands.

Authorities announced they would change the political capital from Bujumbura to Gitega, which is located over 100 kilometers (62 miles) to the east.

šŸ›° SRTM Tile Grabber

This is an awesome tool from Derek Watkins. It makes downloading SRTM data dead simple.

āœ¦

Topography, Bathymetry, Toponymy

December 27, 2018 ā€¢ #

In this latest cartography project Iā€™m working on, Iā€™m rediscovering the tedium of searching for appropriate data. Iā€™ll grant that itā€™s amazing how much high quality data is produced and freely distributed, but given the advances of web technology, itā€™s frustrating to see how bad many of the web map content management systems are.

Of course the difficulty of finding data depends on the geographic area. I happen to be working on a region thatā€™s pretty sparse, so some data (like rasters) can be harder to find.

Here are a few resources Iā€™ve either found or rediscovered worth sharing:

  • GEBCO Gridded Bathymetry ā€” Quality bathymetric data for wide areas is hard to find, which is no wonder considering how difficult it is to create. This GEBCO dataset has 30 arc-second and 1 arc-minute resolution grids, which are pretty good for smaller scale (wide area) maps.
  • The National Map Downloader ā€” The main datasource for open content from USGS. Iā€™m using this for some DEM data and contours, but thereā€™s also NAIP imagery, hydrography products, and GNIS place names. I even found where you can browse their staged products in raw format directly on S3, versus navigating the downloader GUI.
  • GeoNames ā€” I want a deep source for place names on the map, but not just cities. Iā€™m looking for natural features like capes inlets, mountains, islands, rocks, shoals, creeks, and others. Iā€™ve also got OpenStreetMap for this, but itā€™s inconsistent in rural areas especially. GeoNames canā€™t be beat for this level of depth and consistency. Wherever anything obvious is missing, I can fill in with my own data layers.

Another thing this project has prompted is a revivifying of my gazetteer project for working with GeoNames data1. The dataset has evolved in format and been updated since I last touched this tool in ~2013, so I had to make some changes to get it to work again. Since GeoNames is delivered in a raw text format, the goal of this tool is to automate loading the data into PostGIS for easier, faster use in QGIS.

  1. This deserves a full post at some point later. Iā€™ve always had a soft spot for place name data, so more attention on GeoNames and tools for working with it is worth it. ā†©

āœ¦
āœ¦

Weekend Reading: Largest Islands, Linework, and Airline Mapping

December 22, 2018 ā€¢ #

This week is some reading, but some simple admiring. I wanted to highlight the work of two cartographers I follow that is fantastic. We live in a great world that people can still make a living producing such work.

šŸ Hundred Largest Islands

A beautiful, artistic work from David Garcia sorting each islandā€™s landmass by area. My favorite map projects arenā€™t just eye candy, they also teach you something. I spent half an hour on Wikipedia reading about a few of these islands.

šŸ›© On Airline Mapping

This is a project from cartographer Daniel Huffman using a combination of open datasets, projection twisting, meticulous design, and Illustrator skills. The finished product is really amazing. The attention to detail is stunning. I love the detailed step-by-step walkthrough on how it came together.

šŸ—ŗ Project Linework

A library of vector graphics for cartographic design. Each one has a unique style and could be used in other products, since itā€™s public domain (awesome). This is another cool thing from Daniel Huffman.

Both of these guys do amazing work. Find more on their websites:

āœ¦

Video Mapping in OpenStreetMap with Fulcrum

December 16, 2018 ā€¢ #

With tools like Mapillary and OpenStreetCam, itā€™s pretty easy now to collect street-level images with a smartphone for OpenStreetMap editing. Point of interest data is now the biggest quality gap for OSM as compared to other commercial map data providers. Itā€™s hard to compete with the multi-billion dollar investments in street mapping and the bespoke equipment of Google or Apple. Thereā€™s promise for OSM to be a deep, current source of this level of detail, but it requires true mass-market crowdsourcing to get there.

The businesses behind platforms like Mapillary and OpenStreetCam arenā€™t primarily based on improving OSM. Though Telenav does build OSC as a means to contribute, their business is in automotive mapping powered by OSM, not the collection tool itself. Mapillary on the other hand is a computer vision technology company. They want data, so opening the content for OSM mapping attracts contributors.

Iā€™ve been collecting street-level imagery for years using windshield mounts in my car, typically for my own purposes to add detail in OSM. Since we launched our SpatialVideo feature in Fulcrum (over 4 years ago now!), Iā€™ve used that for most of my data collection. While the goals of that feature in Fulcrum are wider than just vehicle-based data capture, the GPS tracking data with SpatialVideo makes it easier to scrub through spatially to find whatā€™s missing from the map. My personal workflow is usually centered on adding points of interest, but street furniture, power infrastructure, and signage are also present everywhere and typically unmapped. You can often see addresses on buildings, and I rarely find new area where the point of interest data is already rich. Thereā€™s so much to be filled in or updated.

This is a quick sample of what video looks like from my dash mount. Itā€™s fairly stable, and the mounts are low-cost. This is the SV player in the Fulcrum Editor review tool:

One of the cool things about the Fulcrum format is that itā€™s video, so that smoothness can help make sure youā€™ve got each frame needed ā€” particularly on high speed thoroughfares. We built in a feature to control the frame rate and resolution of the video recording, so what I do is maximize the resolution but drop the frame rate well below 30 fps. This helps tremendously to minimize the data quantity thatā€™s got to get back to the server. Even 3 or 5 fps can be plenty for mapping purposes. I usually go with 10 or so just to smooth it out a little bit; the size doesnā€™t get too bad until you go past 15 or so.

Of course the downside is that this content isnā€™t available to the public easily for others to map from. Not a huge deal to me, but with Fulcrum Community weā€™re looking at some ways to open this system up to use for contribution, a la Mapillary or OSC.

āœ¦

Weekend Reading: Typing on iPad Pro, Climate Optimism, Visualizing GeoNames

November 24, 2018 ā€¢ #

šŸ“±iPad Diaries: Typing on the iPad Pro with the Smart Keyboard Folio

I swung through an Apple Store a couple of weeks ago to check out the new hardware. The Smart Keyboard Folio has been hard to imagine the experience with in reviews without handling one. Same with the Pencil. I was particularly impressed with the magnetic hold of the Pencil on the side of the device ā€” itā€™s darn strong. The current Smart Keyboard has some deficiencies, as pointed out in this article. No instant access to Siri or at least Siri Dictation, no system shortcut keys for things like volume control and playback, and

ā›ˆ In Defense of Climate Optimism

Quillette always has good stuff. Iā€™m on the side of the author here in general with respect to climate change: itā€™s a problem to be understood and responded to, but the loudest of the proponents of doing something about it propose massive, sweeping, unrealistic changes ā€œor else.ā€ This author and Steven Pinker (quoted in the piece) have the right idea. Take a long, optimistic view and look to history for similar circumstances, and take measured action over time.

šŸ—ŗ Places and Their Names: Observations from 11 Million Place Names

I love analyses like this. Take the open GeoNames database, load it into Postgres, ask questions on patterns using SQL, visualize the distributions.

I wanted to find patterns in the names, so I explored if they started or ended in a certain way or just contained a certain word. With SQL this means that I was using the % wildcard to find prefixes or suffixes. So for instance the following query would return return every word containing the word bad anywhere in the name:

SELECT * FROM geonames WHERE name ILIKE ā€˜%bad%ā€™

This makes me want to revive my old gazetteer project and crawl around GeoNames again.

āœ¦

An Open Database of Addresses

March 27, 2015 ā€¢ #

One of the coolest open source / open data projects happening right now is OpenAddresses, a growing group effort assembling around the problem of geocoding, the process of turning human-friendly addresses into spatial coordinates (and its reverse). Iā€™ve been following the project for close to a year now, but it seems to have really gained momentum in the last 6 months.

The project was started last year and is happening over on GitHub. It now has over 60 contributors, with over 100 million aggregated address points from 20 countries, and growing by the day. Thereā€™s also a live-updating data repository where you can download the entire OpenAddresses dataset onlineā€”itā€™s currently at about 1.1 gigabytes of address points.

Pinellas addresses

Hereā€™s how it works:

Contributors identify data out in the wild online, and contribute small index files with some pointers to where the data is hosted, and some other details indicating how to merge it with the rest of the projectā€™s data format. Thereā€™s no need to download any of the data, only find where the CSV file or web service lives and how to get to it. The technique for this is neat in its simplicity, more on this later.

It sounds weird to think something as basic as address data could be so fascinating and exciting. Most people in the geo community understand the potential impact of projects like this on our industry, but let me review for the uninitiated why this is cool.

Why care about boring addresses?

Address data is what makes almost any map useful: it connects our human-friendly identifiers for places into real locations on the ground. Almost everything that consumers do with maps these days has to do with places of interest: Foursquare checkins, Instagramming, turn-by-turn directions. Without connecting the places as we know them to actual map coordinates a computer can understand, we donā€™t have many useful mapping applications.

There are existing APIs and resources out there to build mapping applications that require addressing and geocoding, but none of them are open to build on. Theyā€™re proprietary systems that either have unfriendly licensing structures for use, or are costly to use. Having to pay money for a high quality geocoding service like Googleā€™s isnā€™t crazy or surprisingā€Šā€”ā€Šbuilding universally searchable and uniform address databases is insanely expensive and hard. Building good geocoding systems is one of the perennial pains in the ass of the geospatial problem set, so itā€™s understandable that when someone solves it, theyā€™d want to charge for it.

There is the OpenStreetMap project, the free and open map database for the globe, which has tons of potential as a resource for geocoding. By a quick estimate, the OSM database contains something like 50 million specific address points for the globe. But its license is not compatible with most commercial requirements for republication of data, so developers looking for an open resource have had to look elsewhere. Thereā€™s still no good worldwide, open resource for address geocoding that app developers and mappers can use with no strings attached. (OSMā€™s license and its ā€œfriendlinessā€ for commercial use has a long history of debate and argument in the community. Itā€™s complicated. Iā€™m not a lawyer.)

Address data harder than it looks

Simple data, big problem

The data that composes a postal address is pretty straightforward: house number, street name, city, admin boundary, postal code. That set of 6 properties gets you to a fixed coordinate on the Earth in most places with organized addressing schemes. Pretty simple, right?

But addressing systems are non-standard, vary widely with geography, and are actually non-existent in many countries. The data literally carpets the developed world and comes in dozens of shapes and formats, so bringing it all together into a consistent, unified whole to create a platform for applications is a huge deal.

In the US, for example, one of the biggest challenges is that there isnā€™t a single standardized structure for the data, and even worse, no single ā€œownerā€ of address data. Sometimes dataā€™s maintained at the county level, and sometimes the city level. One countyā€™s GIS division will manage it, and in another itā€™s the E911 system manager. Then you have the challenge of finding the actual data files. Itā€™s becoming commonplace for municipalities to publish this stuff online, but itā€™s far from universal. To get data for some (especially rural) counties, you better be ready to take a hard drive down to the property appraiserā€™s office to get the data, or pay them to burn you a CD.

To me this is where the OpenAddresses model gets interesting. The project is bringing a powerful capability for building a massive open dataset, a distributed network of contributors, and focusing their resources around a common goal. Creating a central place around which the contributors can mobilize and gradually accrete data into a larger and larger whole, thatā€™s the unique angle to this project. Anyone with enough time and energy can go chase down hundreds of datasets, but itā€™s much easier when a group with a defined mission can divide and conquerā€Šā€”ā€Šintersecting the open source contribution model with a data production line. Itā€™s not just a platform for aggregating this data into a single database, itā€™s a petitioning system to start the process of tracking down the data, and to advocate for it to be made open if it currently isnā€™t publicly available.

OpenAddresses US status

Building the glue

The OpenStreetMap method of contribution is one where contributors are manually finding, converting, and adding data to a separate database. For addresses, this strategy makes ingesting the individual datasets and the thousands of updates per year a huge pain. OA takes a different approach. Instead of manually finding and merging all the datasets together, the main OA repository is a huge pile of index files that function as the glue between all the disparate sources out on the web and a centralized core. Itā€™s an open source ETL system for all flavors of address datasets. People go out and find all the building blocks, and OA is the place where we write the instructions to put them all together.

The project isnā€™t only the data. Itā€™s tools for working with the data, resources for teaching local advocacy for acquiring the data, and a system of ETL ā€œglueā€ to bring the sources together to build a platform for other tools and creative mapping projects. Go over to the project and check it out. If you know where some address data is for your neighborhood, dive in and contribute to the effort.

āœ¦

Bringing Geographic Data Into the Open with OpenStreetMap

September 9, 2013 ā€¢ #

This is an essay I wrote that was published in the OpenForum Academyā€™s ā€œThoughts on Open Innovationā€ book in early summer 2013. Shane Coughlan invited me to contribute on open innovation in geographic data, so I wrote this piece on OpenStreetMap and its implications for community-building, citizen engagement, and transparency in mapping. Enjoy.

OpenStreetMapWith the growth of the open data movement, governments and data publishers are looking to enhance citizen participation. OpenStreetMap, the wiki of world maps, is an exemplary model for how to build community and engagement around map data. Lessons can be learned from the OSM model, but there are many places where OpenStreetMap might be the place for geodata to take on a life of its own.

The open data movement has grown in leaps and bounds over the last decade. With the expansion of the Internet, and spurred on by things like Wikipedia, SourceForge, and Creative Commons licenses, thereā€™s an ever-growing expectation that information be free. Some governments are rushing to meet this demand, and have become accustomed to making data open to citizens: policy documents, tax records, parcel databases, and the like. Granted, the prevalence of open information policies is far from universal, but the rate of growth of government open data is only increasing. In the world of commercial business, the encyclopedia industry has been obliterated by the success of Wikipedia, thanks to the worldā€™s subject matter experts having an open knowledge platform. And GitHubā€™s meteoric growth over the last couple of years is challenging how software companies view open source, convincing many to open source their code to leverage the power of software communities. Openness and collaborative technologies are on an unceasing forward march.

In the context of geographic data, producers struggle to understand the benefits of openness, and how to achieve the same successes enjoyed by other open source initiatives within the geospatial realm. When assessing the risk-reward of making data open, itā€™s easy to identify reasons to keep it private (How is security handled? What about updates? Liability issues?), and difficult to quantify potential gains. As with open sourcing software, it takes a mental shift on the part of the owner to redefine the notion of ā€œownershipā€ of the data. In the open source software world, proprietors of a project can often be thought of more as ā€œstewardsā€ than owners. They arenā€™t looking to secure the exclusive rights to the access and usage of a piece of code for themselves, but merely to guide the direction of its development in a way that suits project objectives. Map data published through online portals is great, and is the first step to openness. But this still leaves an air gap between the data provider and the community. Closing this engagement loop is key to bringing open geodata to the same level of genuine growth and engagement thatā€™s been achieved by Wikipedia.

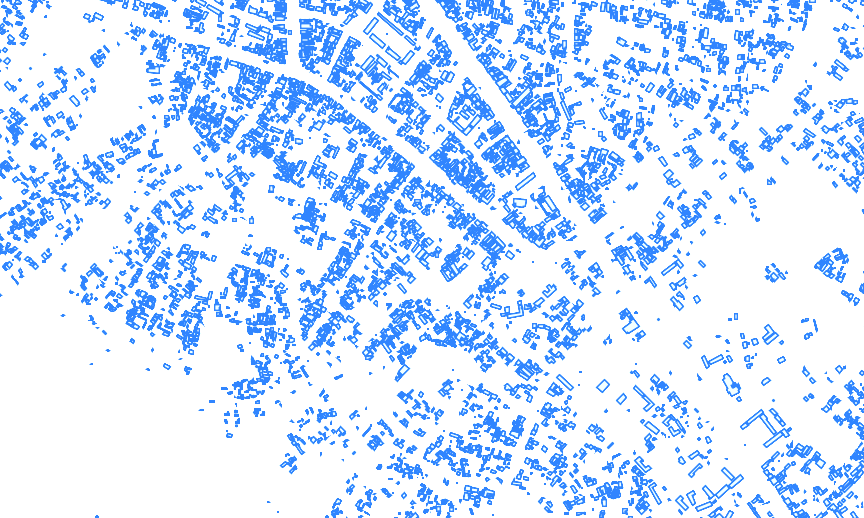
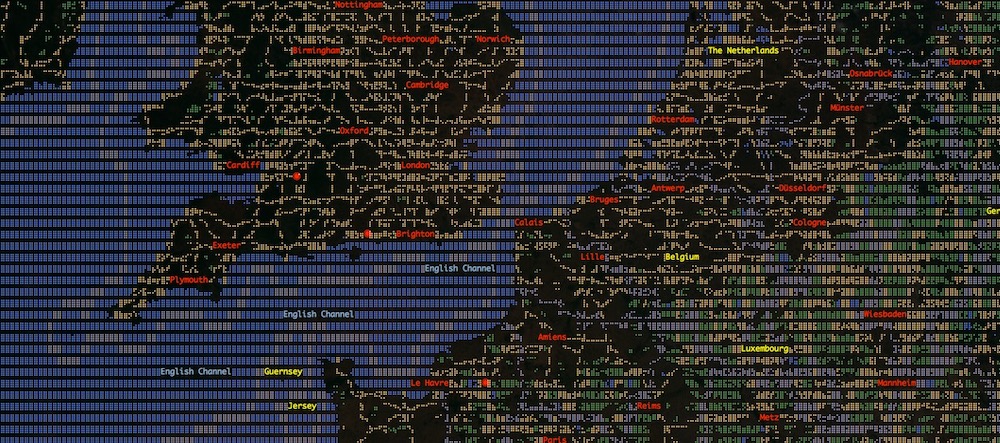
An innovative new approach to open geographic data is taking place today with the OpenStreetMap project. OpenStreetMap is an effort to build a free and open map of the entire world, created from user contributions ā€“ to do for maps what Wikipedia has done for the encyclopedia. Anyone can login and edit the map ā€“ everything from business locations and street names to bus networks, address data, and routing information. It began with the simple notion that if I map my street and you map your street, then we share data, both of us have a better map. Since its founding in 2004 by Steve Coast, the project has reached over 1 million registered users (nearly doubling in the last year), with tens of thousands of edits every day. Hundreds of gigabytes of data now reside in the OpenStreetMap database, all open and freely available. Commercial companies like MapQuest, Foursquare, MapBox, Flickr, and others are using OpenStreetMap data as the mapping provider for their platforms and services. Wikipedia is even using OpenStreetMap as the map source in their mobile app, as well as for many maps within wiki articles.

What OpenStreetMap is bringing to the table that other open data initiatives have struggled with is the ability to incorporate user contribution, and even more importantly, to invite engagement and a sense of co-ownership on the part of the contributor. With OpenStreetMap, no individual party is responsible for the data, everyone is. In the Wikipedia ecosystem, active editors tend to act as shepherds or monitors of articles to which theyā€™ve heavily contributed. OpenStreetMap creates this same sense of responsibility for editors based on geography. If an active user maps his or her entire neighborhood, the feeling of ownership is greater, and the user is more likely to keep it up to date and accurate.

Open sources of map data are not new. Government departments from countries around the world have made their maps available for free for years, dating back to paper maps in libraries ā€“ certainly a great thing from a policy perspective that these organizations place value on transparency and availability of information. The US Census Bureau publishes a dataset of boundaries, roads, and address info in the public domain (TIGER). The UKā€™s Ordnance Survey has published a catalog of open geospatial data through their website. GeoNames.org houses a database of almost ten million geolocated place names. There are countless others, ranging from small, city-scale databases to entire country map layers. Many of these open datasets have even made their way into OpenStreetMap in the form imports, in which the OSM community occasionally imports baseline data for large areas based on pre-existing data available under a compatible license. In fact, much of the street data present in the United States data was imported several years ago from the aforementioned US Census TIGER dataset.

Open geodata sources are phenomenal for transparency and communication, but still lack the living, breathing nature of Wikipedia articles and GitHub repositories. ā€œCrowdsourcingā€ has become the buzzword with public agencies looking to invite this type of engagement in mapping projects, to widely varying degrees of success. Feedback loops with providers of open datasets typically consist of ā€œreport an issueā€ style funnels, lacking the ability for direct interaction from the end user. By allowing the end user to become the creator, it instills a sense of ownership and responsibility for quality. As a contributor, Iā€™m left to wonder about my change request. ā€œDid they even see my report that the data is out of date in this location? When will it be updated or fixed?ā€ The arduous task of building a free map of the entire globe wouldnā€™t even be possible without inviting the consumer back in to create and modify the data themselves.

Enabling this combination of contribution and engagement for OpenStreetMap is an impressive stack of technology that powers the system, all driven by a mesh of interacting open source software projects under the hood. This suite of tools that drives the database, makes it editable, tracks changes, and publishes extracted datasets for easy consumption is produced by a small army of volunteer software developers collaborating to power the OpenStreetMap engine. While building this software stack is not the primary objective of OSM, itā€™s this that makes becoming a ā€œmapperā€ possible. There are numerous editing tools available to contributors, ranging from the very simple for making small corrections, to the power tools for mass editing by experts. This narrowing of the technical gap between data and user allows the novice to make meaningful contribution and feel rewarded for taking part. Wikipedia would not be much today without the simplicity of clicking a single ā€œeditā€ button. Thereā€™s room for much improvement here for OpenStreetMap, as with most collaboration-driven projects, and month-by-month the developer community narrows this technical gap with improvements to contributor tools.

In many ways, the roadblocks to adoption of open models for creating and distributing geodata arenā€™t ones of policy, but of technology and implementation. Even with ostensibly ā€œopen dataā€ available through a government website, data portals are historically bad at giving citizens the tools to get their hands around that data. In the geodata publishing space, the variety of themes, file sizes, and different data formats combine to complicate the process of making the data conveniently available to users. What good is a database Iā€™m theoretically allowed to have a copy of when itā€™s in hundreds of pieces scattered over a dozen servers? ā€œPermissionā€ and ā€œaccessibilityā€ are different things, and both critical aspects to successful open initiatives. A logical extension of opening data, is opening access to that data. If transparency, accountability, and usability are primary drivers for opening up maps and data, lowering the bar for access is critical to make those a reality.

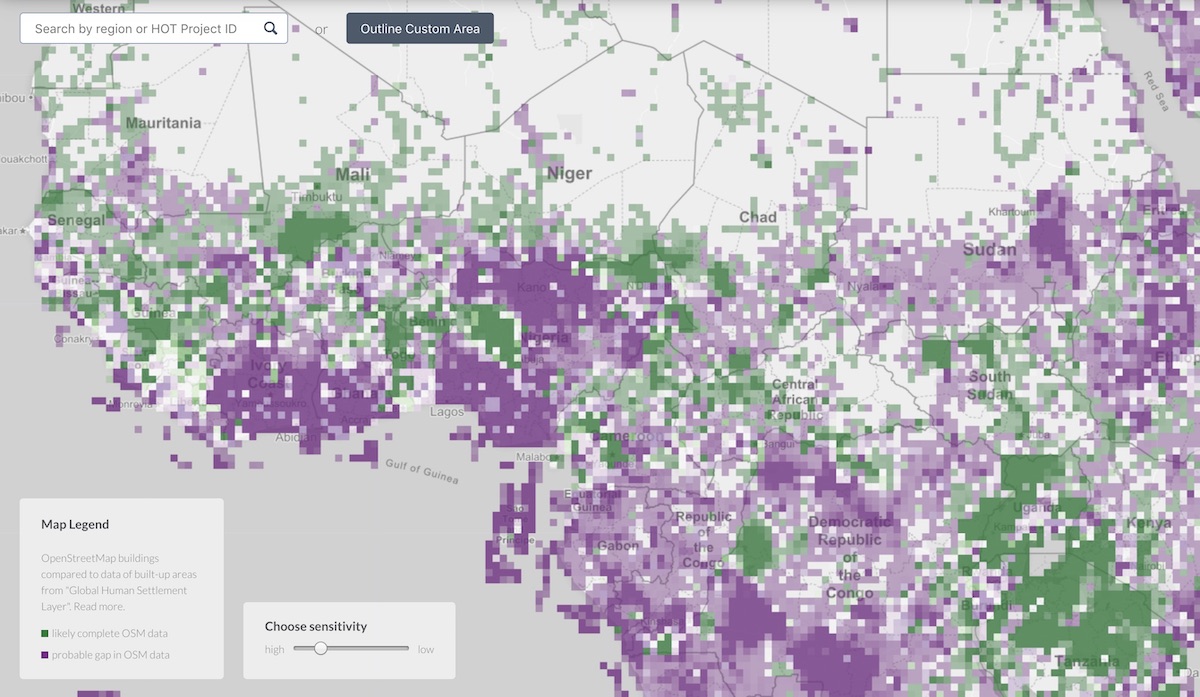
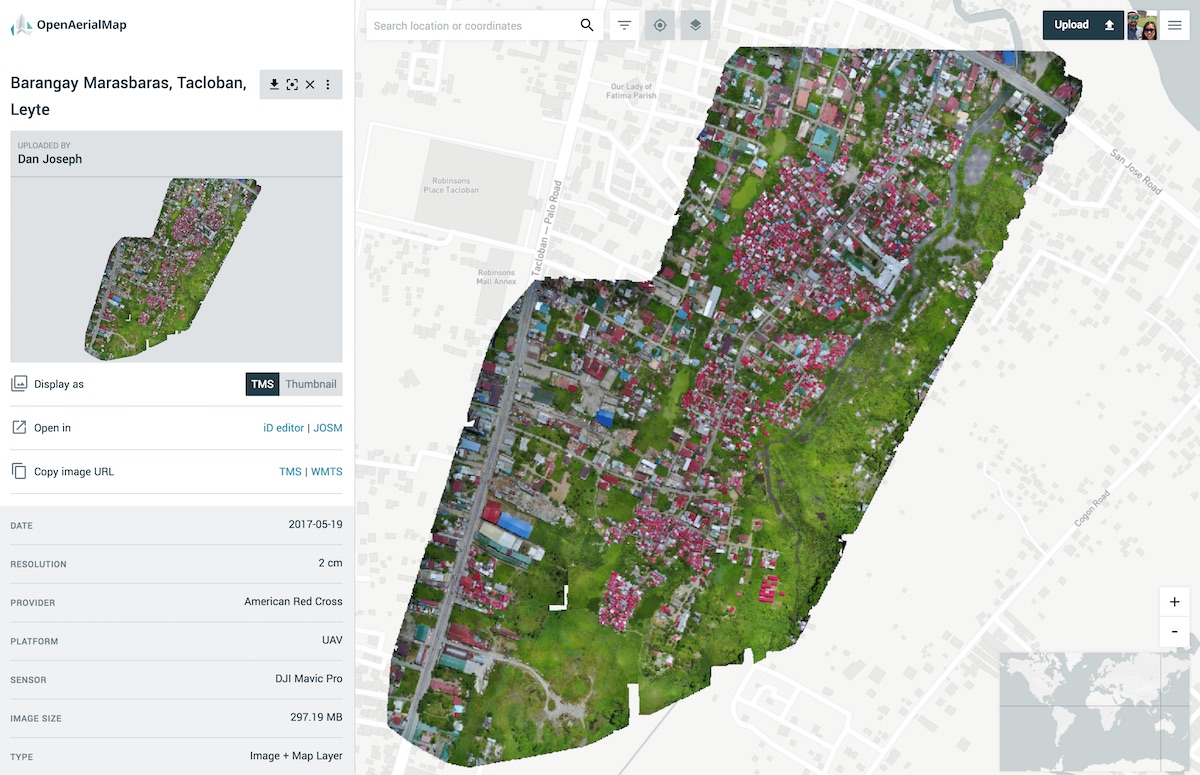
A great example the power of the engagement feedback loop with OpenStreetMap is the work of the Humanitarian OpenStreetMap Teamā€™s (HOT) work over the past few years. HOT kicked off in 2009 to coordinate the resources resident in the OpenStreetMap community and apply them to assist with humanitarian aid projects. Working both remotely and on the ground, the first large scale effort undertaken by HOT was mapping in response to the Haiti earthquake in early 2010. Since then, HOT has grown its contributor base into the hundreds, and has connected with dozens of governments and NGOs worldwideā€”such as UNOCHA, UNOSAT, and the World Bankā€”to promote open data, sharing, transparency, and collaboration to assist in the response to humanitarian crises. To see the value of their work, you need look no further than the many examples showing OpenStreetMap data for the city of Port-au-Prince, Haiti before and after the earthquake. In recent months, HOT has activated to help with open mapping initiatives in Indonesia, Senegal, Congo, Somalia, Pakistan, Mali, Syria, and others.

One of the most exciting things about HOT, aside from the fantastic work theyā€™ve facilitated in the last few years, is that it provides a tangible example for why engagement is such a critical component to organic growth of open data initiatives. The OpenStreetMap contributor base, which now numbers in the hundreds of thousands, can be mobilized for volunteer contribution to map places where that information is lacking, and where it has a direct effect on the capabilities of aid organizations working in the field. With a traditional, top-down managed open data effort, the response time would be too long to make immediate use of the data in crisis.

Another unspoken benefit to the OpenStreetMap model for accepting contributions from a crowd is the fact that hyperlocal map data benefits most from local knowledge. Thereā€™s a strong desire for this sort of local reporting on facts and features on the ground all over the world, and the structure of OpenStreetMap and its user community suits this quite naturally. Mappers tend to map things nearby, things they know. Whether itā€™s a mapper in a rural part of the western United States, a resort town in Mexico, or a flood-prone region in Northern India, thereā€™s always a consumer for local information, and often times from those for whom itā€™s prohibitively expensive to acquire. In addition to the expertise of local residents contributing to the quality of available data, we also have local perspective that can be interesting, as well. This can be particularly essential to those humanitarian crises, as thereā€™s a tendency for users to map things that they perceive as higher in importance to the local community.

Of course OpenStreetMap isnā€™t a panacea to all geospatial data needs. There are many requirements for mapping, data issue reporting, and opening of information where the data is best suited to more centralized control. Data for things like electric utilities, telecommunications, traffic routing, and the like, while sometimes publishable to a wide audience, still have service dependencies that require centralized, authoritative management. Even with data that requires consolidated control by a government agency or department, though, the principles of engagement and short feedback loops present in the OpenStreetMap model could still be applied, at least in part. Regardless of the model, getting the most out of an open access data project requires an ability for a contributor to see the effect of their contribution, whether itā€™s an edit to a Wikipedia page, or correcting a one way street on a map.

With geodata, openness and accessibility enable a level of conversation and direct interaction between publishers and contributors that has never been possible with traditional unilateral data sharing methods. OpenStreetMap provides a mature and real-world example of why engagement is often that missing link in the success of open initiatives.

The complete book is available as a free PDF download, or you can buy a print copy here.

āœ¦

Creating New Contributors to OpenStreetMap

January 15, 2013 ā€¢ #

I wrote a blog post last week about the first few months of usage of Pushpin, the mobile app we built for editing OpenStreetMap data.

As I mentioned in the post, Iā€™m fascinated and excited by how many brand new OpenStreetMap users weā€™re creating, and how many who never edited before are taking an interest in making contributions. This has been an historic problem for the OpenStreetMap project for years now: How do you convince a casually-interested person to invest the time to learn how to contribute themselves?

There are two primary hurdles Iā€™ve always seen with why ā€œinterested usersā€ donā€™t make contributions; one technical, and one more philosophical:

  1. Editing map data is somewhat complicated, and the documentation and tools donā€™t help many users to climb over this hump.
  2. Itā€™s hard to answer the question: ā€œWhy should I edit this map? What am I editing, and who benefits from the information?ā€

To the first point, this is an issue largely of time and effort on the part of the volunteer-led developer community behind OpenStreetMap. GIS data is fundamentally complex, much moreso than Wikipediaā€™s content, the primary analog to which OpenStreetMap is often comparedā€”ā€œWikipedia for mapsā€. Itā€™s an apt comparison only on a conceptual level, but when it comes time to build an editor for the information within each system, the demands of OpenStreetMap data take the complexity to another level. As I said, the community is constantly chewing this issue, and making amazing progress on a new web-based editor. In building Pushpin, we spent a long time making sure that the user didnā€™t need to know anything about the complex OpenStreetMap tagging system in order to make edits. We picked apart the wiki and taginfo to abstract the common tags into simple picklists, which prevents both the need to type lots of info, and the need to know that amenity=place_of_worship is the proper tag for a church or mosque.

As for answering the ā€œwhyā€, thatā€™s a little more complicated. People contribute to community projects for a host of reasons, so itā€™s a challenge to nail down how this should be communicated about OSM. There are stray bits around that tell the story pretty succinctly, but the problem lies in centralizing that core message. The LearnOSM site does a good job of explaining to a non-expert what the benefits are of becoming part of the contributor community, but it feels like the story needs to be told somewhere closer to the main homepage. Alex Barth recently proposed an excellent idea to the OpenStreetMap mailing list, a ā€œcontributors markā€ that can be used within OSM-based services to convey the value of free and open map data. This is an excellent idea that addresses a couple of needs. For one it communicates what the project actually is, rather than just sending the unsuspecting user to a page about ODbL, and it also gives a general sense of how the data is used by real people.

In order for those one million user accounts to turn into one million contributors, we need to do a better job at conveying the meaning of the project and the value it provides to OpenStreetMapā€™s thousands of data consumers.

āœ¦

Local Knowledge

July 29, 2011 ā€¢ #

Here are the slides from my talk at the first ever Ignite Tampa Bay. It was a blast to watch all the great talks from such a varied set of interests and passions. Great turnout, too ā€” we drew a sellout crowd out to watch.

As difficult as it is to prepare for Ignite (20 slides, 15 seconds each, autoadvancing), I would do it again in a heartbeat. Iā€™ve essentially done zero public speaking, so itā€™s nerve-wracking for me to stand up in front of 100+ people and talk at all ā€” but itā€™s something Iā€™ve always wanted to get better at, so I just jumped in. Now that itā€™s all over, Iā€™m glad I did. So when the videos are edited and live, Iā€™ll post that, too.

Thanks to all the organizers and presenters for a smashing first Ignite!

āœ¦
āœ¦